
Here’s a graph showing the number of tests done each day (green) plotted against the cumulative number of tests that returned positive for the SARS-CoV-2 virus.(blue)
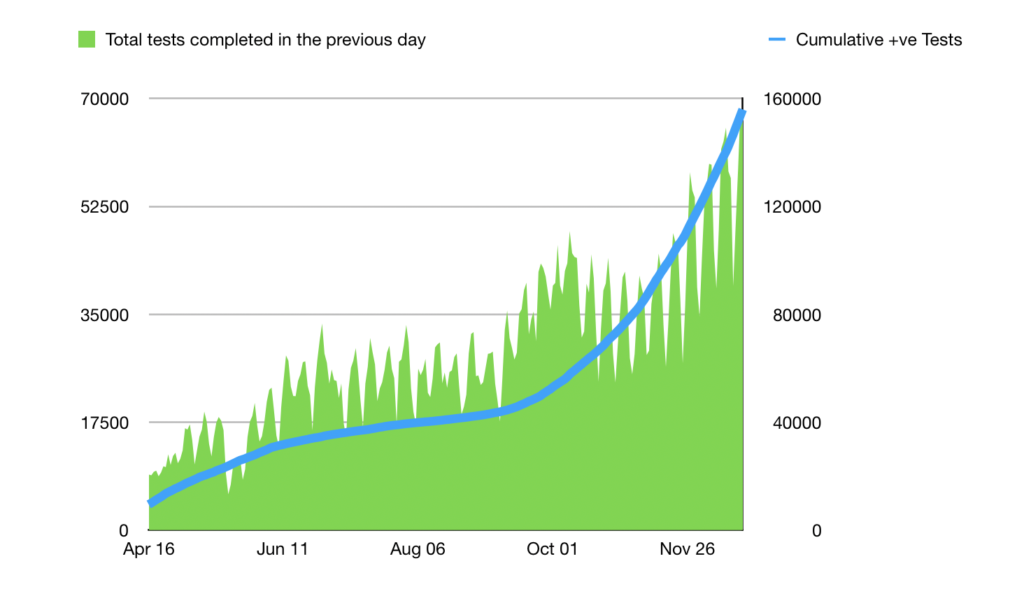
Notice that, as the number of tests increases (green), the cumulative number of positive test results increases proportionately. (blue)
Explanation: If you put more fisherman on the lake, you catch more fish, but the number of fish caught by each fisherman doesn’t change. Ford’s put more fishermen on the lake, so he’s catching more fish, but it’s not as though there’s been an explosion – a “second wave” – in the fish population.
Here’s a graph showing the the cumulative number of positive test results (blue) plotted against the percentage of tests that returned positive for the SARS-CoV-2 virus. (green)
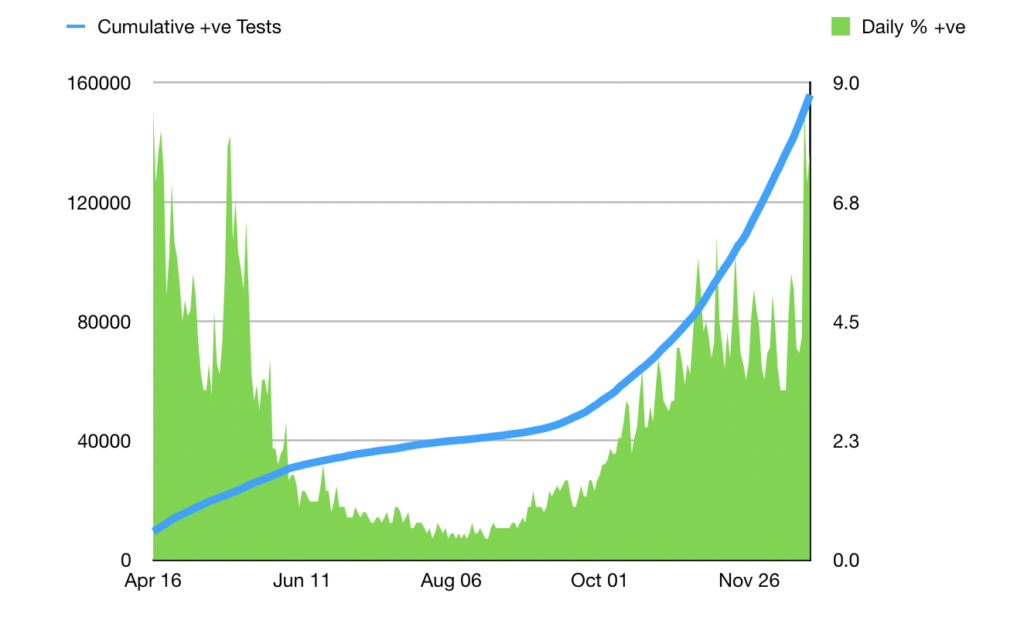
Explanation: The percentage of tests that came back positive was highest in the Spring of 2020 but generally bopped around 3 and 5 percent. That *percentage* dropped to below 1% in the summer (not flu season). As we entered flu season again (Fall), the percentage of tests that came back positive has again usually bopped around between 3 and 5 percent. Testing is way up, but – with the vast majority of tests having a negative (i.e., the person does not have the virus) result – the percentage of those tests that come back positive does not appear to be rising to dramatic levels. Rather, it appears that as the percentage of people with respiratory illness increases (i.e., during flu and cold seasons), the percentage of people getting a Coronavirus test increases. During flu season, the proportion of tests that come back positive increases by approximately 3 to 4 percentage points.
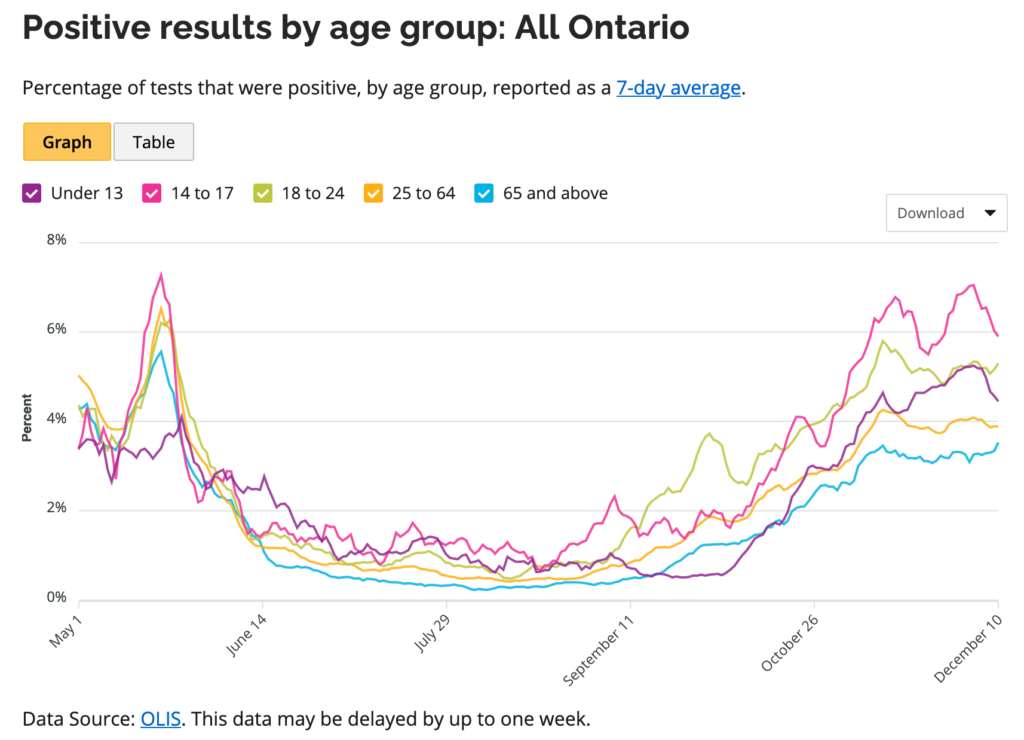
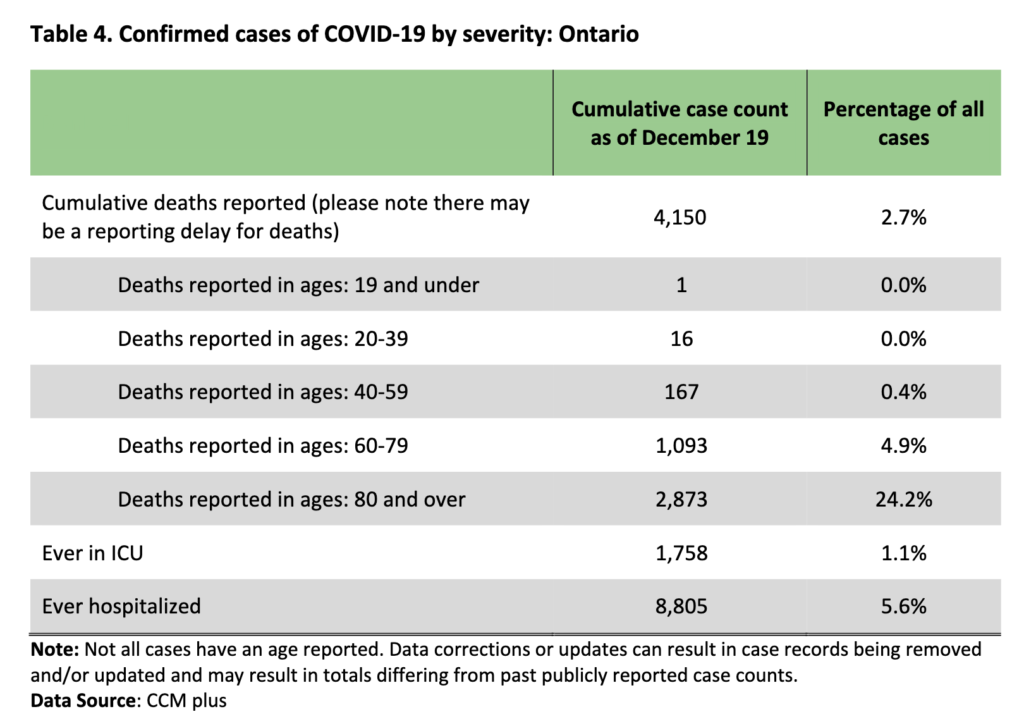
Whether those who test positive for the virus are suffering from Covid-19 (which is not the Coronavirus: Covid-19 is a respiratory illness that some Coronavirus-infected people develop), from some other respiratory illness, or from no illness at all, is not disclosed by the provincial government. However, the largest increases in Coronavirus infections are among those younger than 65 years of age and those in that age bracket who become infected with Coronavirus are not suffering respiratory illness or death at anything near the rate of those 65 and over.
Data sources:
“Daily Summary of Cases in Ontario” – https://www.ontario.ca/page/how-ontario-is-responding-covid-19?fbclid=IwAR2D0b_mQbG1xCe-I1RPsvESdPo8dCAzEcpA8ZirV_Dn13UOUFjgVqHwqP0
Daily test totals: https://covid-19.ontario.ca/data (Raw data is available for download there)
{Paul McKeever is the leader of the Freedom Party of Ontario, in Canada}
Document Details:
Author: Freedom Party leader, Paul McKeever
Publication date: December 20, 2020.