
Here’s a graph showing the number of tests done each day (blue) plotted against the cumulative number of tests that returned positive for the SARS-CoV-2 virus.
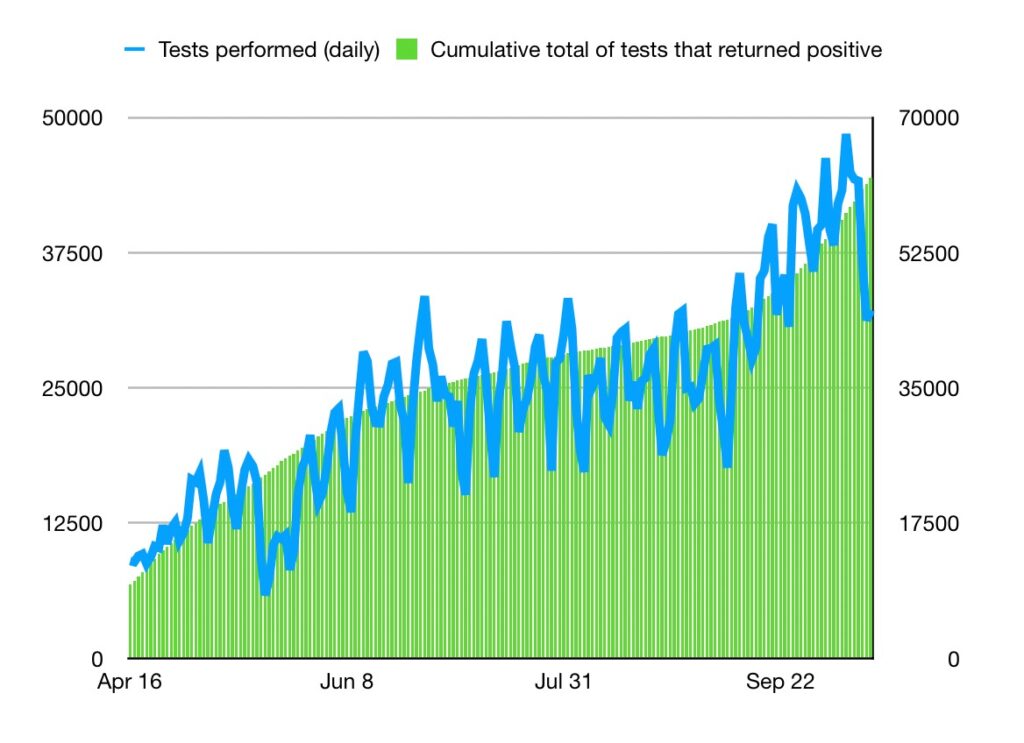
Notice that, as the number of tests increases, the cumulative number of positive test results increases proportionately.
Explanation: If you put more fisherman on the lake, you catch more fish, but the number of fish caught by each fisherman doesn’t change. Ford’s put more fishermen on the lake, so he’s catching more fish, but it’s not as though there’s been an explosion – a “second wave” – in the fish population.
Here’s a graph showing the the cumulative number of positive test results (blue) plotted against the percentage of tests that returned positive for the SARS-CoV-2 virus.
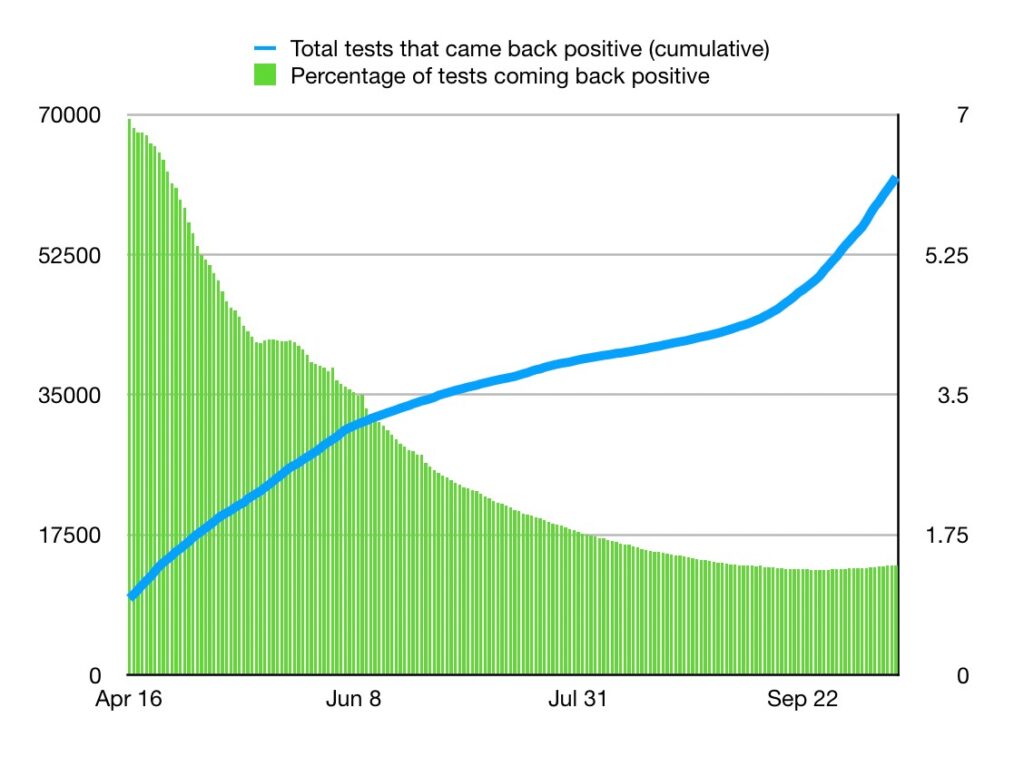
Explanation: Over time, the total number of tests that return a positive result increases as the days go by (and, if you increase the number of tests performed each day, you increase the number of positive results obtained each day). But the *percentage* of tests that come back positive has dropped over time and is currently levelling out at about 1.4%. There is no “second wave”.
Data sources:
“Daily Summary of Cases in Ontario” – https://www.ontario.ca/page/how-ontario-is-responding-covid-19?fbclid=IwAR2D0b_mQbG1xCe-I1RPsvESdPo8dCAzEcpA8ZirV_Dn13UOUFjgVqHwqP0
Daily test totals: https://covid-19.ontario.ca/data (Raw data is available for download there)
{Paul McKeever is the leader of the Freedom Party of Ontario, in Canada}
Document Details:
Author: Freedom Party leader, Paul McKeever
Publication date:October 15, 2020, 2020.
Original publication location: Paul McKeever’s facebook.com account – https://www.facebook.com/pmckeever